Results and imaging are read in two places: quickly, from the chart rail beside the visit, and properly, in the chart itself.
Results at a glance
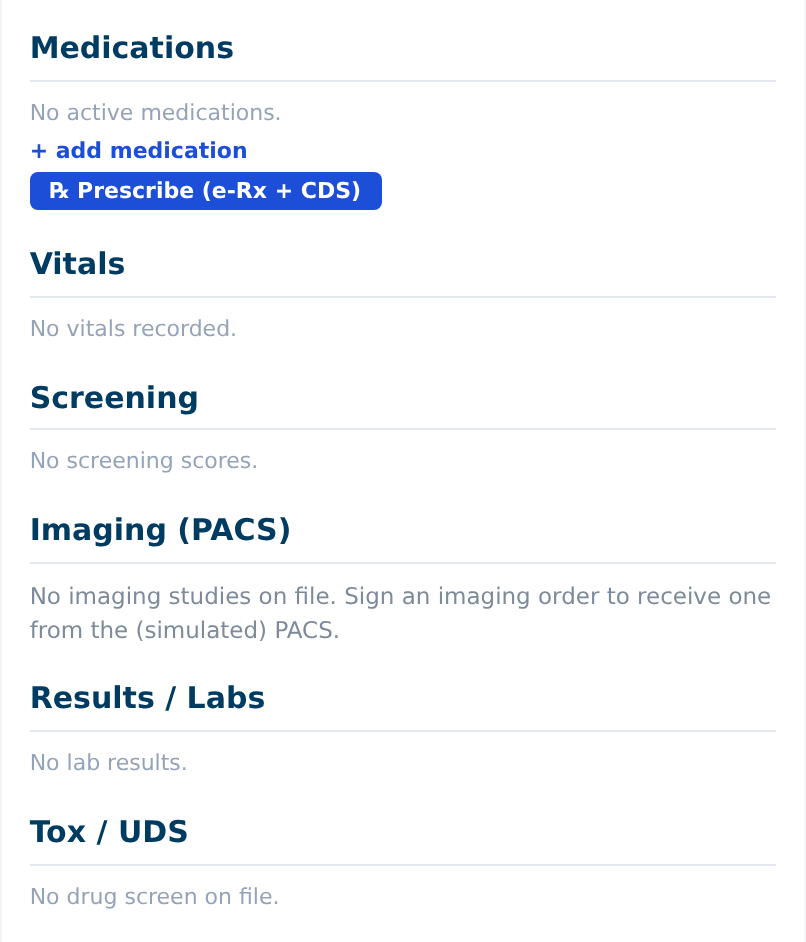
The chart rail beside the encounter has a Results section: each row is the test, the value and the unit, with an abnormal marker in red — ⚠ low or ⚠ high — where the value is flagged.
Its footnote is a boundary worth knowing: Full resulting flows through Orders; this records point-of-care values.
The same ⚠ marker appears wherever results do — in the orders list as ⚠ abnormal, in the chart, and in the pre-visit brief as ⚠ Abnormal: [label].
How an abnormal result reaches you
There is no "acknowledge this result" button. Instead, a resulted lab routes into the inbox as a case — the message when it happens is Lab resulted — abnormal value(s); sent to inbox. — and you work it there with the ordinary inbox steps: review the values, tell the patient, document the interpretation.
To see a value over time rather than once, use Open flowsheet from the chart's find popup — Trend this value over time.
Imaging
The imaging panel lists studies as [modality] [description] · [accession] · [date], with a button per image — 🖼 [caption] — and a Report toggle.
Empty, it tells you how one gets there: No imaging studies on file. Sign an imaging order to receive one from the (simulated) PACS.
The viewer opens with the study description, then modality, accession, caption and pixel dimensions — and an amber SYNTHETIC — not a real study badge in training and demo practices.
Controls along the bottom: −, a percentage, +, Fit, 100%, and the hint scroll to zoom · drag to pan.
On the right: Save to note (during an encounter), which becomes ✓ Saved to note, and Close ✕.
Saved images appear in the signed note under Images (saved from the PACS viewer).
What the software will not do
It will not interpret the image. Not the film, not a tracing, not a waveform. The assistant's own evidence drawer says it: No image or signal is interpreted.
That is a deliberate line. Software that interprets a medical image is regulated as a device; this product stays on the other side of that line, and the viewer is a viewer.
What usually goes wrong
Waiting for a result to appear in the visit. Results arrive in the Inbox, as cases.
Reading a value once and moving on. If it matters, trend it.
Assuming the report is a read. The Report toggle shows what came with the study. Your interpretation is yours, and belongs in the note.
Forgetting Save to note. An image you looked at during the visit is not in the note unless you put it there.